Graphs and notes from Weber 1977
-
I've been researching the history of utility simulations, and it seems the paper that started it all is Weber 1977 (though these technically aren't simulations, since he calculated closed-form expressions analytically). Anyway, the paper isn't OCRed or bookmarked or searchable, so I had to actually skim through the whole thing with my own eyes.
Weber's "Effectiveness" is the same thing as Merrill's "Social Utility Efficiency", which is the same thing as Shentrup's "Voter Satisfaction Index", which is the same thing as Quinn's "Voter Satisfaction Efficiency": The utility of the winning candidate (totalled across all voters) , as a fraction of the distance between the average utility of all candidates (= average of many random winners) and the utility of the best candidate. For example, this winner would have a value of 75%:
--------- Best candidate

--------- Actual winner

---------

---------

--------- Average of all candidates
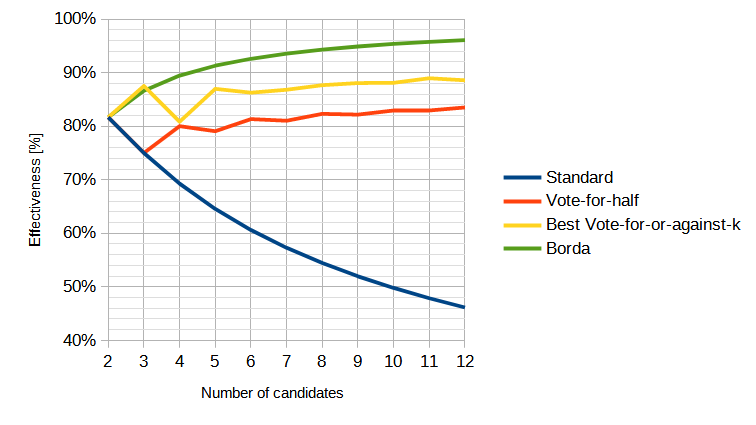
The paper doesn't have any graphs, just the expressions and a single table of a few Effectiveness values. I put the expressions into a spreadsheet and plotted various things, and verified against the table:
Here is The Effectiveness of Several Voting Systems table from p. 19 of Reproducing Voting Systems, except in graphical form and with more values calculated:

- Standard is of course First Past the Post, and we all know how that works.
- Vote-for-half is Approval voting, except that all voters use the identical strategy of approving half of the candidates.
- This sounds similar, but is not the same, as Merrill's Approval strategy, in which all voters approve of any candidates of above-average utility (optimal from the voter's perspective, without any info from polls). Although this would be half approvals per ballot on average, it's not always half for an individual voter.
- (In a quick test, it seems that the optimal strategy provides higher social utility than Weber's, but I haven't double-checked my code.)
- (Weber does recognize that this is the optimal strategy, and says that voters using optimal strategy is assumed throughout the paper, but then … doesn't actually do that?)
- This sounds similar, but is not the same, as Merrill's Approval strategy, in which all voters approve of any candidates of above-average utility (optimal from the voter's perspective, without any info from polls). Although this would be half approvals per ballot on average, it's not always half for an individual voter.
- Best Vote-for-or-against-k uses the Vote-for-or-against-k method, with k set to the value that maximizes social utility for a given number of candidates (about 1/3).
- Vote-for-or-against-k, in turn, is the method in which voters can choose to vote for k candidates, or against k candidates. So this can be thought of as combined approval voting, but with every voter using this same strategy. (I assume these strategies were used just because they were easier to calculate analytically.)
- Borda is Borda count
Weber gets a Social Utility Efficiency of 82% for all two-candidate elections, while Merrill gets 100%. This is because Merrill normalizes utilities before finding the utility winner in each election. I think Weber's approach makes more sense, since I believe that elections with polarizing majoritarian winners beating broadly-liked candidates really do happen. WDS refers to this discrepancy, too, because honest Score voting could actually get to 100%:
Note that when C = 2, achievable voting systems will not achieve zero BR. That error made in a previous study [17] probably indicates it had a computer programming “bug.”
(I think Weber mentions this, too, but assumes that everyone would normalize to min/max and so it would end up equivalent to Approval. But now I can't find it. Maybe that was another paper. I'll edit this later.)
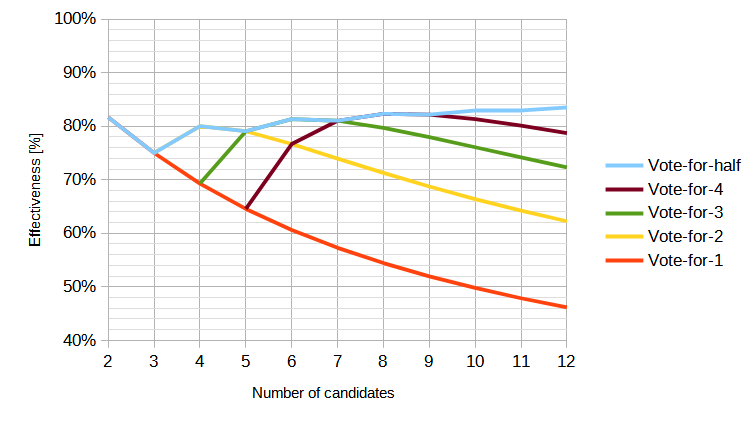
Here's "Vote-for-k":

- Vote-for-1 is just FPTP
- Vote-for-half is the value of k that produces the best social utility for a given number of candidates, when every voter uses it, as above.
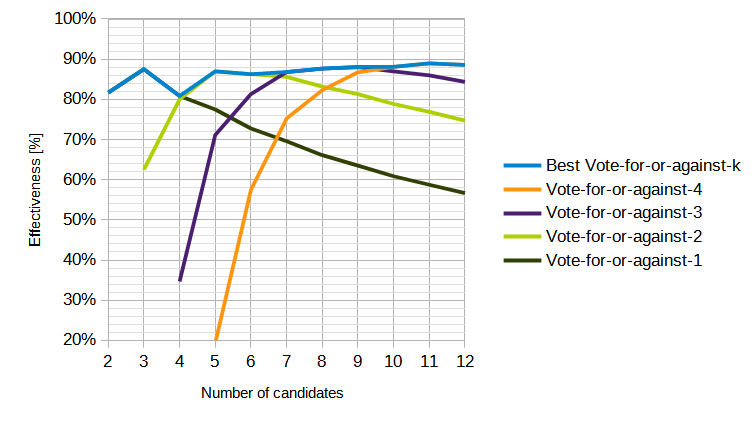
Here's "Vote-for-or-against-k":

- Vote-for-or-against-1 is the same as "negative vote" or "bipolar voting" or "balanced plurality voting".
- Best Vote-for-or-against-k is just value of k for a given number of candidates that provides the highest social utility when every voter uses it, as above.
These all use the "random society" model, so not super realistic, but still useful for relative comparisons of methods and for verifying Monte Carlo simulations against.
(I was going to transcribe the expressions here for other's convenience, but math markup doesn't work yet.)
-
So I noticed a discrepancy while reproducing these statistically. Vote-for-1 tends to be too high, and Vote-for-(n-1) tends to be too low:

(Vote-for-(n-1) is essentially Anti-plurality voting. )
These should be the same, according to him:
It is interesting to observe that the vote-for-k and vote-for-(n-k) voting systems are equally effective.
Plotting just those two, it seems to just be a consequence of Weber calculating for infinite voters vs me simulating finite numbers of voters:
10 voters, 100,000 iterations:

100 voters, 100,000 iterations:

1,000 voters, 100,000 iterations:

100,000 voters, 100,000 iterations (took 3 hours):

(Standard and Vote-for-1 are the same thing, but implemented differently, so I was plotting both to make sure there wasn't a bug in one.)
I don't really understand why this happens, but good to keep in mind that number of voters does matter in these kinds of simulations.